
Poster of the Northeast Nevada Earthquake of 21 February 2008 - Magnitude 6.0
Tectonic Summary
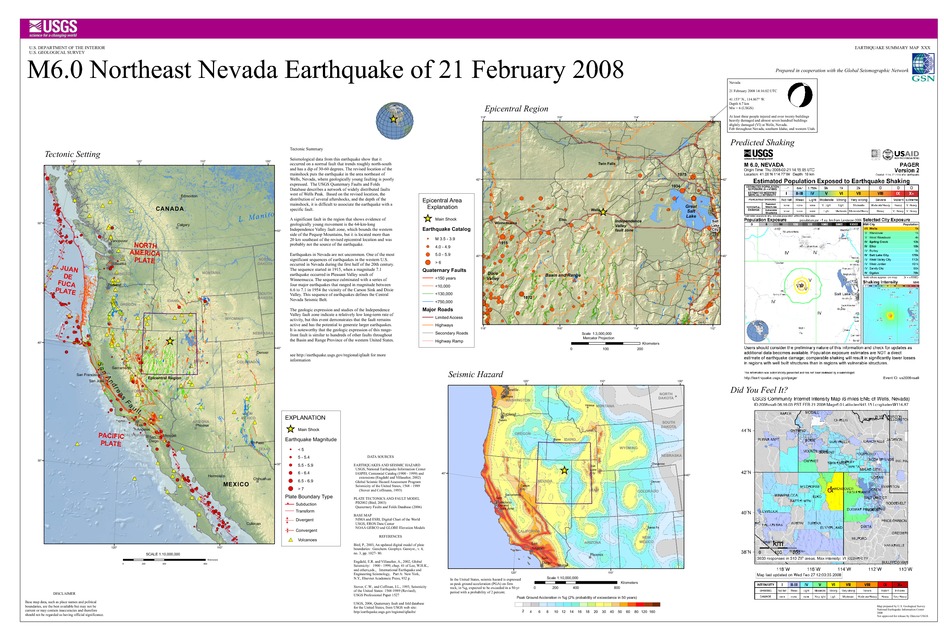
Seismological data from this earthquake show that it occurred on a normal fault that trends roughly north-south and has a dip of 30-60 degrees. The revised location of the mainshock puts the earthquake in the area northeast of Wells, Nevada, where geologically young faulting is poorly expressed. The USGS Quaternary Faults and Folds Database describes a network of widely distributed faults west of Wells Peak. Based on the revised location, the distribution of several aftershocks, and the depth of the mainshock, it is difficult to associate the earthquake with a specific fault.
A significant fault in the region that shows evidence of geologically young movement is the 64-km-long Independence Valley fault zone, which bounds the western side of the Pequop Mountains, but it is located more than 20 km southeast of the revised epicentral location and was probably not the source of the earthquake.
Earthquakes in Nevada are not uncommon. One of the most significant sequences of earthquakes in the western U.S. occurred in Nevada during the first half of the 20th century. The sequence started in 1915, when a magnitude 7.1 earthquake occurred in Pleasant Valley south of Winnemucca. The sequence culminated with a series of four major earthquakes that ranged in magnitude between 6.6 to 7.1 in 1954 the vicinity of the Carson Sink and Dixie Valley. This sequence of earthquakes defines the Central Nevada Seismic Belt.
The geologic expression of normal faults north of Wells indicate relatively low long-term rates of activity, but this event demonstrates that these faults remains active and have the potential to generate sizeable earthquakes. It is noteworthy that the geologic expression of normal faults northeast of Wells is similar to hundreds of other faults throughout the Basin and Range Province of the western United States.
Downloads

Settings
The posters may be downloaded for viewing or for printing on a color
plotter. Adobe PDF (.pdf) format files are provided. Adobe Acrobat 6.0 or
higher is required for viewing the PDF file on a computer monitor and for
printing the PDF map graphic. IMPORTANT: The PDF map graphic was produced
using TrueType fonts; change the following setting to:
Page(Print)Setup<Properties<Layout<Advanced<Graphic<TrueTypeFont<DownloadAsSoftFont
Attention MAC users: If you have problems viewing the pdf files, please download the pdf file and view it in the lastest verion of Adobe Acrobat.
